
How to Make a Strava Activity Dashboard with Plotly and Dash - Awesome Strava Charts #6
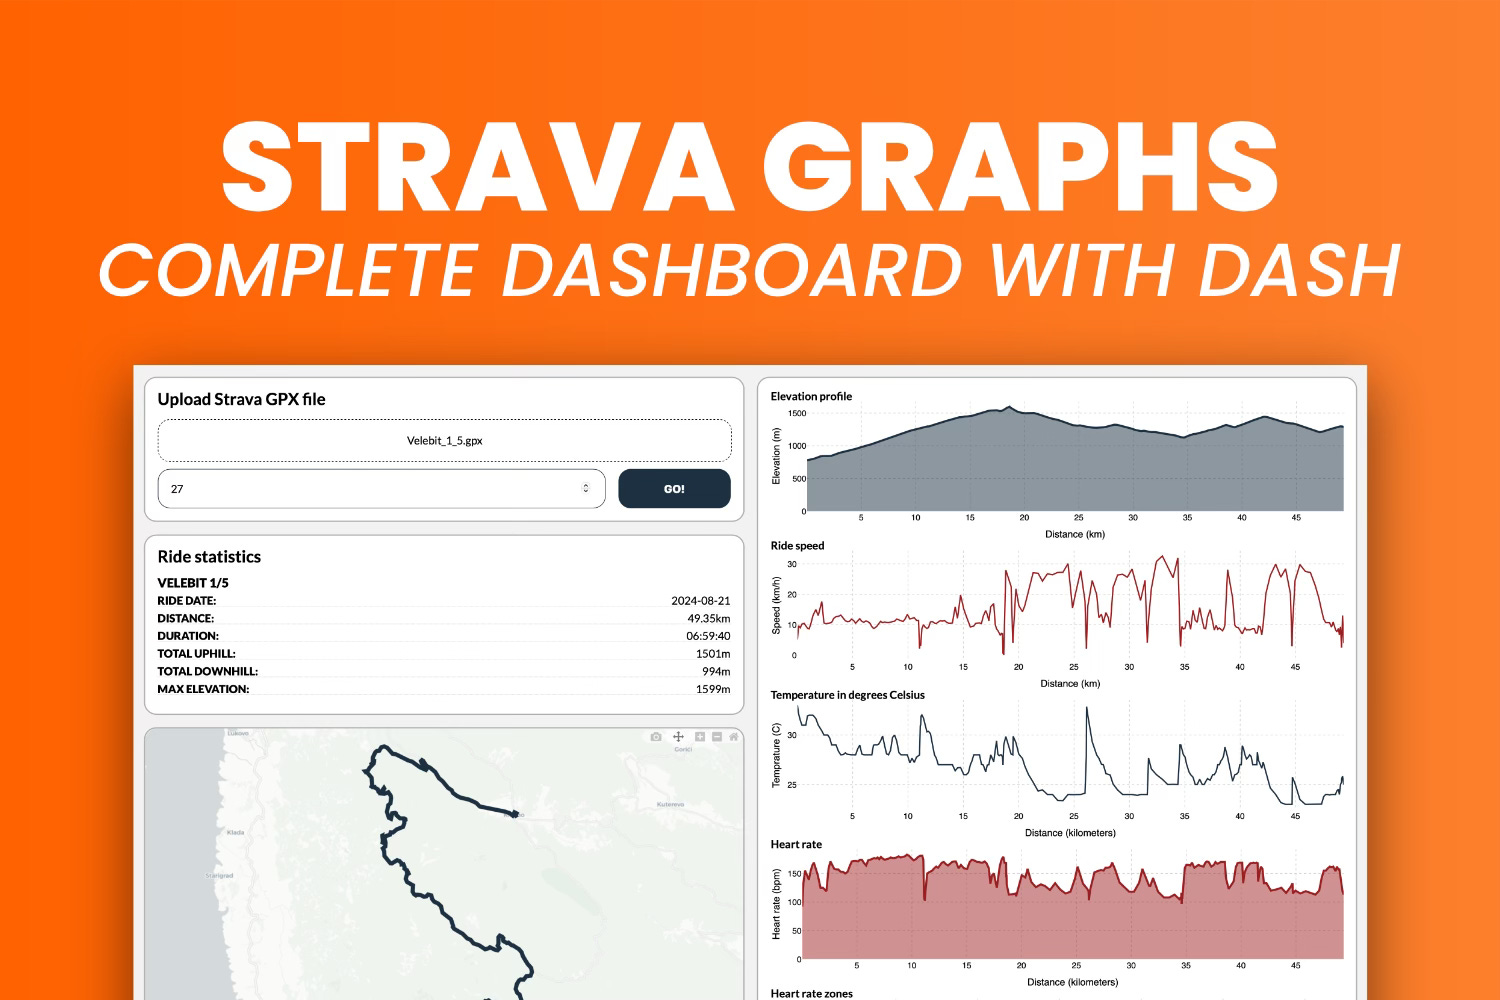
It's time to connect everything. Learn how to create a Dash app that lets you upload a Strava GPX file to see awesome ride statistics.

This is gonna be a long one.
It’s time to put everything together. It’s time to create a Python app that lets you upload a GPX file and view charts that even Strava’s premium version doesn’t offer. The good part? You already know how to preprocess the data and build the UI components. The bad part? It’s still going to be a painfully involved process.
I’ll guide you through it step by step.
You’ll build the app through 3 checkpoints. In the first one, you’ll make sure the data processing pipeline works and that there’s actually some data to show in the app. In the second, you’ll build every chart as an individual component. And in the third, you’ll connect the dots with Python’s Dash library.

If you’re a paid subscriber, you can download the source code and the data here.
You’ll need to install the following Python libraries to follow along. Make sure to match the version I’m using:
dash==2.17.1
gpxpy==1.6.2
numpy==2.1.1
pandas==2.2.2
plotly==5.23.0
Let’s start with the first checkpoint - getting the data processing pipeline in order.
Checkpoint #1 - GPX File Processing
You’ll do most of the heavy lifting in this section.
The goal is to create a Python file with functions to load a GPX file, extract chart data, and save it in a JSON file.
Start by organizing your project folder like this (my GPX file is available here):
.
├── data
│   └── src_mtb_ride.gpx
└── utils
    └── gpx_parser.py
All data processing logic happens in utils/gpx_parser.py. Let me walk you through it next.
utils/gpx_parser.py
You’ll need to implement the following functions in the gpx_parser.py file:
__load_gpx_file()- Loads a GPX file from a provided parameter.__seconds_to_hhmmss()- Converts an integer representing seconds into HH:MM:SS format. The original route duration is in seconds, so this helper function translates it into a more readable format.__extract_basic_stats()- Returns a dictionary showing a route name, date, duration in HH:MM:SS format, distance in kilometers, total uphill and downhill in meters, and max elevation in meters.__extract_point_data()- Returns a Pandas DataFrame containing individual data points and corresponding values for latitude, longitude, elevation, distance from start, time of day, time and distance from the previous GPS point, speed in meters per second and kilometers per hour, temperature in degrees Celsius, and heart rate.__prep_data_for_charts()- Applies necessary data transformations and resamples it into 1-minute averages. This removes the noise from data and reduces the number of data points.get_map_data()- Gives you a dictionary of all map latitude and longitude pairs, but also a center point for the map.get_common_chart_data()- Returns data for elevation, speed, temperature, and heart rate charts, including X/Y values, title, and axis labels.get_heart_rate_zones_chart_data()- Calculates heart rate zones based on the age provided by the user and returns the values for plotting.get_gradient_charts()- Returns data for two charts: route gradients at a point in time, and gradient ranges as distance traveled in 14 distinct gradient bins.parse_and_save()- Utilizes all of the previous functions to construct a single dictionary with chart data and saves it to disk as a JSON file.load_parsed_data()- Loads the previously saved JSON file and returns it as a Python dictionary.
Yup, it’s a lot.
But you’ve seen all this logic in the previous five articles.
Here’s the code:
Keep reading with a 7-day free trial
Subscribe to Data Doodles with Python to keep reading this post and get 7 days of free access to the full post archives.